THE education site for computer science and ICT
2. Graphs
The problem needs to be modelled in such a way that a computer program can be applied to solve it. This modelling is done by the use of a graph structure. We have a section on graphs here. This is a typical graph
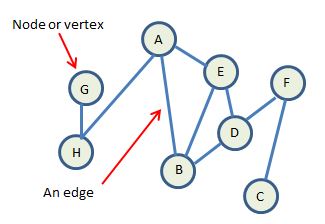
The graph represents an abstraction of the problem.
Each circle in the graph is called a vertex or node and they are labelled in some way to represent the data being modelled.
Each connection is called an edge.
In order to apply the graph to a path-finding algorithm, each edge needs to have some measure associated with it. This measure is called the cost.
For example a graph can be used to model a road network. Each vertex is a waypoint or location and each edge is a road. In this case the cost could be distance or it could be travel time. For example:
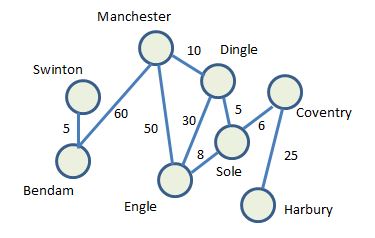
Having a value associated with each edge means that a least-cost path can be worked out. The nodes themselves could also have a cost associated with it. This kind of arrangement is called a weighted graph.
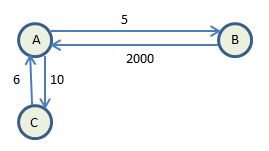
Furthermore, edge direction could be shown as arrows rather than lines, in which case it is a directed weighted graph.
The graph above is showing a single edge between nodes. With a directed graph, there could be two arrows indicating that cost may depend on direction. For example, below, if A,B is modelling a one-way street, going from A to B costs 5 but the other way is much more, indicating it is not a feasible path. You could even eliminate the backwards path to indicate it is not a legitimate path.
Graphs are very versatile in modelling search and optimisation problems and are widely used in fields such as artifcial intelligence.
Challenge see if you can find out one extra fact on this topic that we haven't already told you
Click on this link: Using network graphs